A Big Picture Approach to Seeing the Forest Through the Trees
 As anyone who sits within earshot of me will attest, I love few things more than a good idiom. Near the top of my list of favorite sayings are ones encouraging people to change up their perspective, to see the forest through the trees or to see the big picture.
This idea of not getting lost in the details is relevant in any number of situations but has interesting application when it comes to nonprofits and how they look to understand the members and donors that make up their constituency. Thanks to technology and the advent of big data, it’s never been easier to segment the information to recognize patterns, understand activity and even anticipate behavior.
But data points within your system are just one tree in a much larger forest – just a fragment of a much larger picture. Data may allow you to segment down to the individual or a group related by a particular attribute (age or role in your organization) but often the systems are only capturing engagement with your organization.
A donor or member is more than a name on a contact record – they’re a person, with multiple dimensions. Their preferences and view of the world are informed by trends and experiences organizations may not have visibility into such as:
- Their lives at home, or their households
- Their ideology and voting preferences
- Their digital lives, including their use of social media
No one is suggesting doing these kinds of deep dives with individual constituents, but it’s worth looking at broader demographic and psychographics to help provide context for some of what you may be seeing in your organization. Consider social media. If you were looking at social media in the context of your organization – say, in 2006 – you wouldn’t have seen adoption of many of the sites popular with today’s donors and members.
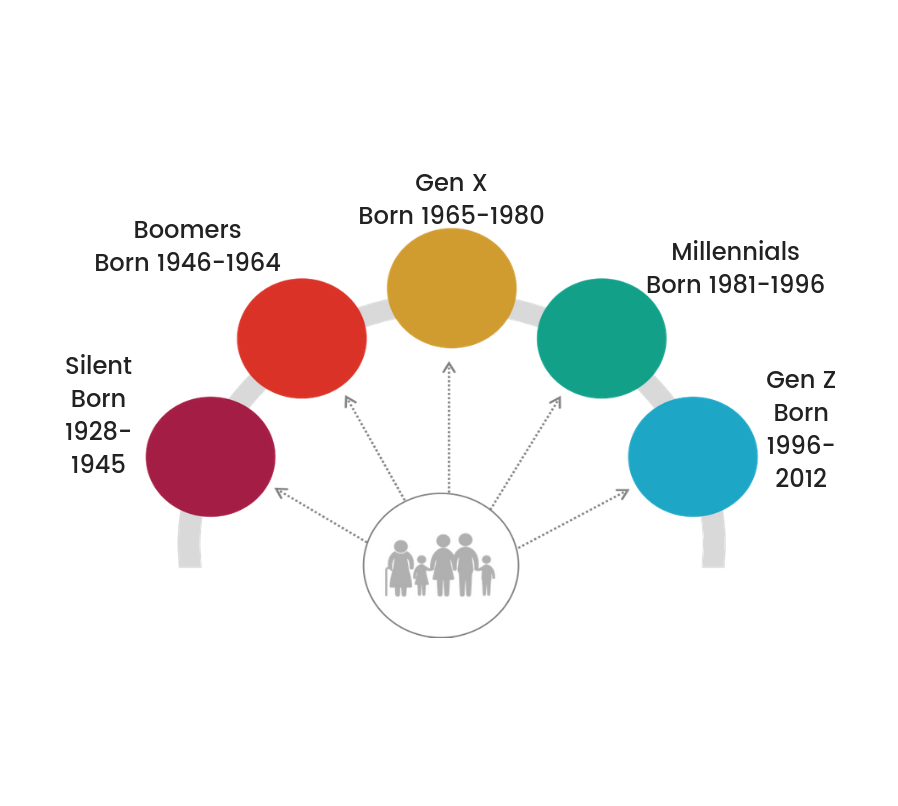
Taking a broader view and looking at consumer behavior proved helpful in expanding the perspective of the nonprofit sector. Nonprofits are trying to attract, retain and engage constituents – which are a broader, more diverse group than ever before. One of the most efficient ways to look at key themes across a large audience is to understand behavior in terms of generations, or (in sociology terms) a birth cohort, a group of people who experience the same significant events within a given period of time.
We looked at everyone from the Silent Generation (born 1928-1945) through Generation Z (1997-2012). Some of what we saw validated things we believed to be true but there were surprises as well. For example:
- Many associations have focused on Millennials, but Generation Z will comprise 20% of the workforce in 2021, just over 2 years away. And they have distinctly different preferences than their Millennial predecessors, with a different vision for their career.
- And, the difference in usage between Millennials and Gen Z when it comes to one of the most popular social media sites? Well, it’s…a lot.
- Speaking of Millennials—many of them are mid-career, with the oldest members of the generation approaching 40 with kids of their own.
- And what about Gen X, at the prime of their career? As far as generations go, they’re smaller in number but now account for more than a third of the income in the U.S.
That’s just the tip of the iceberg.
Each of these data points has implications that can be used to better understand and inform your strategy, giving depth and texture to the member and donor groups you’re already tracking in your AMS or CRM.
We’ll be exploring these in greater detail in our on-demand webinar, Talkin’ ‘Bout my Generation. Join us as we review the latest data from leading research organizations including Pew and Nielsen to:
- Explore the background and demographics for various segments, from Boomers to Gen Z (Spoiler: There’s more than ONE Boomer group…)
- Dive deep into key trends influencing generational behavior as members and donors
- Share best practices on how to reach them and tips on how to bring these unique audiences together as a single group to support your mission.
